Effective collaboration – it’s not rocket science!
Collaboration is the beating heart of science. For many teachers and professors in the sciences, one key component requiring collaboration is designing experiments. The initial experimental setup, presenting your research question to others, and later publishing your results and findings as a journal paper, all require close and ongoing collaboration with your peers, wherever in the world they might be based.
Another key component is visualizing your experimental design as a flowchart. Once you’ve created your flowchart this isn’t set in stone; it will need future revisions based on peer feedback. Your diagram is essentially a living visualization, requiring alterations over the course of the experiment.
In this blogpost, we’ll be looking into the process of designing an experiment in detail, and how draw.io and Confluence can assist you at every step of the way. We’ll even be looking further ahead to when you’re ready to publish your experiment results as part of a manuscript involving co-authors.
Designing your next experiment
1. Your scientific question
Every experiment begins with a question you want to answer. You might be testing an existing theory to see if it still holds true, or experimenting with a new hypothesis to support or disprove something.
When you think you can answer the question you have posed, that’s when your experimental setup comes into play.
2. Setting up your first experimental design
When setting up your next experimental design, you will want to visualize this using a flowchart. At a glance, this flowchart represents everything you and your peers need to know about the experiment: the group(s) that are being investigated versus the control group, the materials and organisms used, how many experiment repetitions you will need, and so on. If you have multiple diagrams as part of your research like biological models, data sets, and schematic diagrams, you can keep all of these in one place by adding new pages in a single diagram.
You can use the knowledge management tool Confluence to create and store your draw.io diagrams. See our related blogpost for more information on what Confluence is, why it’s useful, and how to get started with draw.io in Confluence for free, for up to 10 users.
Create your first diagram in Confluence by creating a new page. Start typing /draw and from the dropdown menu, select draw.io Diagram.

This will take you to the diagram editor where you will start building your flowchart.

To save the latest version of your diagram, press CTRL+S (Windows) or CMD+S (Mac). This will also publish the latest diagram version to the Confluence page you have created it in.
Once you are happy that your flowchart contains all the necessary steps in your experiment, it’s time to gather feedback.
3. Getting feedback on your experimental setup
The feedback stage provides the opportunity for your peers and collaborators to identify any issues with the design setup, along with further ways to improve it.
To gather feedback on your experimental design, you can share the Confluence page containing your diagram with your peers. Using features such as the sketch tool and sticky notes, they can add their feedback to your diagram without editing it directly.

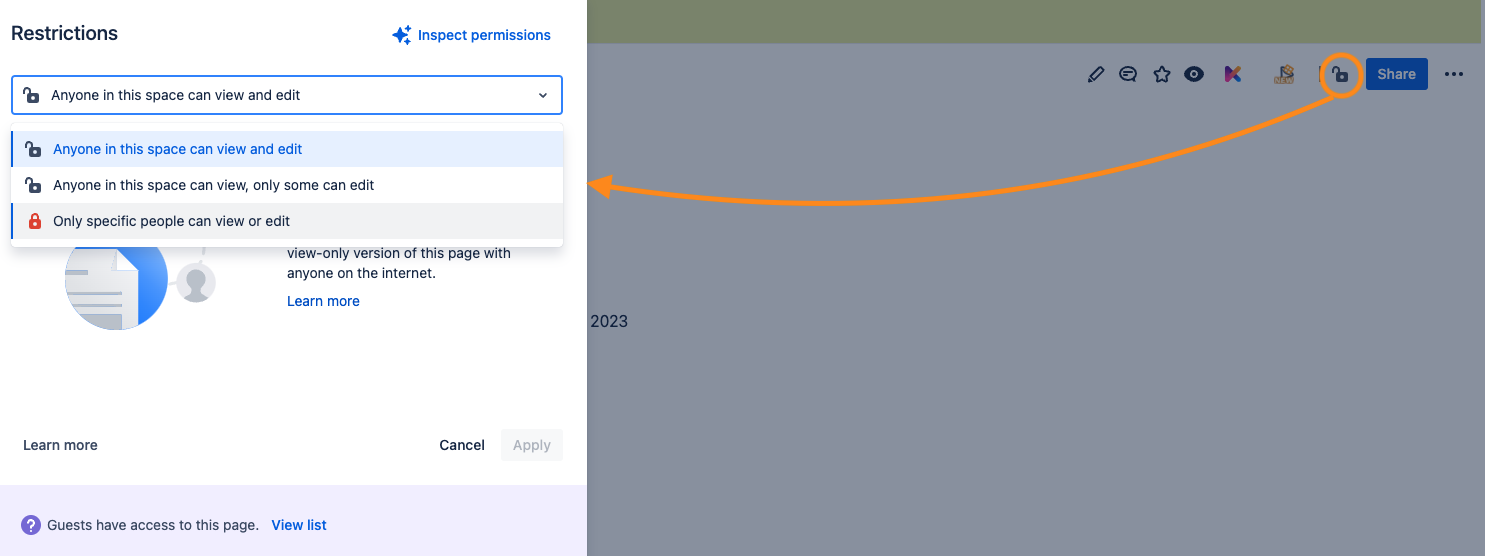
Manage who within your Confluence space can view or edit certain pages, using the Restrictions dropdown. You can even set pages to private, so only you have access to these. Simply click the padlock icon in the top right and update the permissions accordingly.

Revise your diagram accordingly, based on peer feedback. It may take a few iterations to get right, but it’s worth taking the time to plan out your experiment as carefully as possible, so that you don’t lose precious time and resources running an experiment that isn’t well-prepared, and one that will require a lot of changes further down the line.
4. Adding your diagram to a presentation
Once your experimental design is finalized, you are ready to present your research proposal to your group. This is your chance to provide the context and extra details of what you are researching and why.
You won’t need to rebuild your diagram again in PowerPoint or Google Slides. Instead, take advantage of the versatility of draw.io and export your experimental design diagram as a PNG file, to embed directly into your presentation slides.
To do this, in your diagram go to File > Export as > PNG.
Alternatively, select the Advanced… settings to customize the format, diagram dimensions, and DPI of the image, before exporting.

Locate where you have exported the image to, and copy and paste the diagram into the relevant presentation slide.

5. Running your experiment
At this point, you will have taken on board and implemented all feedback, and your peers can no longer find any flaws with your experimental design. Furthermore, you will have already simulated the results you expect to achieve, to determine if the results you actually produce are statistically significant.
It’s now time to run your experiment. Once you get real results, you can determine your next steps. If you need to repeat the experiment, you will first want to update your experimental design flowchart in draw.io to add in different parameters or any other changes.
6. Getting your results ready for publication
When writing up your experiment and getting your results ready for publication, you’ll want to quickly and easily collaborate with your co-authors at any time.
Confluence is the perfect knowledge management tool to collaborate with others. It is your single source of truth, so there’s no need to worry about multiple co-authors accessing different document versions saved in different places.
You always have access to the latest version of your manuscript with Confluence, regardless of where in the world and in which time zones your co-authors are based in.
When co-authors edit and publish a new version, that same page is the only one updated. Features like “@-mentioning” and revision history allow you to quickly notify co-authors of key sections you want to draw their attention to, and to see what’s changed on the page over time.


Confluence is not just for text-based information. Easily embed your experimental design from another Confluence page, along with any other draw.io diagrams you’ve created for the manuscript.
Choose where within the text you want to insert your diagram, start typing /draw and select Embed Diagram:

Your embedded diagram will then be added to the relevant section:

Keep growing your academic skill set
Over the next few weeks, we’ll be showcasing more ways draw.io in Confluence and Jira can help with academic life – so keep an eye on our blog!
Some of the topics already covered, and ones that we will be covering in detail, include:
- Confluence, Jira, and draw.io: the ultimate student toolkit
- The student’s guide to group project greatness, with draw.io
- Visualizing an A+: diagrams for note-taking and exam prep with draw.io and Confluence
- Don’t short circuit: use draw.io for your electrical diagrams
- 3 diagrams every computer science student should know
- 2 diagrams every business major should know
- Eat the elephant: breaking down ideas for your final dissertation/ thesis
Want to dive deeper into the world of draw.io? Access our linktr.ee page to follow us on social media and learn how others use draw.io, as well as pick up some helpful tips and tricks.
Not using draw.io yet? Convince yourself and start your free 30-day trial today. Or book a free no-obligation demo with our customer success team to learn more about how draw.io can make life easier and more productive for you and everyone in (and outside of) your company!
Happy diagramming!
You are currently viewing a placeholder content from Youtube. To access the actual content, click the button below. Please note that doing so will share data with third-party providers.
More InformationLast Updated on October 12, 2023 by Admin

